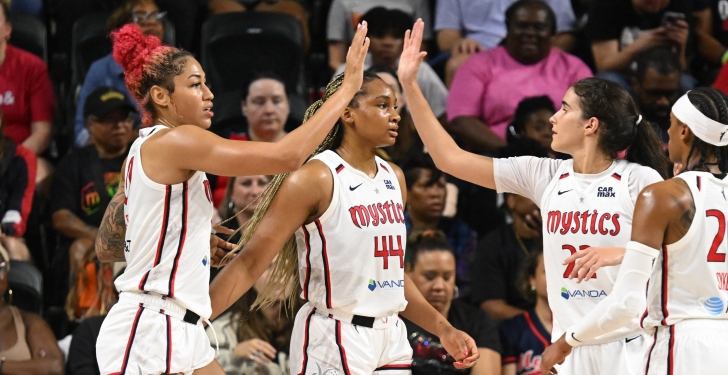
Sami Whitcomb
Sami Whitcomb
2025 Cap Hit
$125,000
2025 Cash
$125,000
Career Earnings
$876,200
2025-2025 Free Agent (CURRENT)
Sami Whitcomb signed a 1 year, $125,000 contract with the Phoenix Mercury, including an average annual salary of $125,000. In 2025, Whitcomb will earn a base salary of $125,000, while carrying a cap hit of $125,000.
Contract Terms:
1 yr(s) / $125,000
Average Salary:
$125,000
Signing Bonus:
N/A
Free Agent:
2026 / UFA
| Year | Age | Status | Cap HitAnnual | Cash Annual | Cash Cumulative | |
|---|---|---|---|---|---|---|
| 2025 |

|
36 |
unprotected
|
$125,000 | $125,000 | $125,000 |
| 2026 |
|
37 |
UFA |
| Year | Age | Status | Base Salary | Cap Hit | |
|---|---|---|---|---|---|
| 2025 |
|
36 |
unprotected
|
$125,000 | $125,000 |
| 2026 |
|
37 |
UFA |
| Year | Age | Status | Base Salary | Cash Total | Cash Cumulative | Cash Remaining | AYC Cumulative | AYC Remaining | |
|---|---|---|---|---|---|---|---|---|---|
| 2025 |
|
36 |
unprotected |
$125,000 | $125,000 | $125,000 | - | $125,000 | $125,000 |
Source:
WNBA contract specifics generally collected from verified reports.
 2023-2024 Free Agent
Contract Terms:
2 yr(s) / $287,500
Average Salary:
$143,750
Signing Bonus:
N/A
Free Agent:
2025 / UFA
To see the rest of the Sami Whitcomb's contract breakdowns, & gain access to all of Spotrac's Premium tools, sign up today. Already Subscribed? Login Here
 2021-2022 Free Agent
Contract Terms:
2 yr(s) / $300,700
Average Salary:
$150,350
Signing Bonus:
N/A
Free Agent:
2023 / UFA
To see the rest of the Sami Whitcomb's contract breakdowns, & gain access to all of Spotrac's Premium tools, sign up today. Already Subscribed? Login Here
2018-2020 Extension
Contract Terms:
3 yr(s) / $168,000
Average Salary:
$56,000
Signing Bonus:
N/A
Free Agent:
2021 / RFA
To see the rest of the Sami Whitcomb's contract breakdowns, & gain access to all of Spotrac's Premium tools, sign up today. Already Subscribed? Login Here
Seasons
8 Years
Career Earnings thru 2025
$876,200
Earnings w/ Different Teams
3 teams
Earnings Per Year
| Year | Age | Team(s) | Status | Cash Total | Cash Cumulative | Awards |
|---|---|---|---|---|---|---|
| 2018 | 29 |
 |
Active
|
$50,000 |
$50,000 |
|
| 2019 | 30 |
|
Active
|
$50,000 |
$100,000 |
|
| 2020 | 31 |
|
Active
|
$68,000 |
$168,000 |
|
| 2021 | 32 |
 |
Active / Protected
|
$150,350 |
$318,350 |
|
| 2022 | 33 |
|
Active / Protected
|
$150,350 |
$468,700 |
|
| 2023 | 34 |
|
Active / Protected
|
$142,500 |
$611,200 |
|
| 2024 | 35 |
|
Active / Protected
|
$140,000 |
$751,200 |
|
| 2025 | 36 |
|
Active / Unprotected
|
$125,000 |
$876,200 |
|
| Total |
$876,200 |
$876,200 |
||||
| Total |
$876,200 |
Earnings Per Team
| Years | Team | Base | Cash Cumulative |
|---|---|---|---|
| 5 |
|
$450,500 | $450,500 |
| 2 |
|
$300,700 | $300,700 |
| 1 |
|
$125,000 | $125,000 |
| Year | Team(s) | Age | Base | Cash Total | Cash Cumulative |
|---|---|---|---|---|---|
| 2018 |
|
29 |
$50,000
|
$50,000 |
$50,000 |
| 2019 |
|
30 |
$50,000
|
$50,000 |
$100,000 |
| 2020 |
|
31 |
$68,000
|
$68,000 |
$168,000 |
| 2021 |
|
32 |
$150,350
|
$150,350 |
$318,350 |
| 2022 |
|
33 |
$150,350
|
$150,350 |
$468,700 |
| 2023 |
|
34 |
$142,500
|
$142,500 |
$611,200 |
| 2024 |
|
35 |
$140,000
|
$140,000 |
$751,200 |
| 2025 |
|
36 |
$125,000
|
$125,000 |
$876,200 |
| Total |
$876,200 |
$876,200 |
$876,200 |
||
| Total |
$876,200 |
$876,200 |
Earnings Per Team
| Years | Team | Base | Cash Cumulative |
|---|---|---|---|
| 5 |
|
$450,500 | $450,500 |
| 2 |
|
$300,700 | $300,700 |
| 1 |
|
$125,000 | $125,000 |
-
Feb 02, 2025
Signed a 1 year $125,000 contract with Phoenix (PHX)
-
Feb 03, 2023
Signed a 2 year $287,500 contract with Seattle (SEA)
-
Feb 10, 2021
Signed a 2 year $300,700 contract extension with New York (NY)
-
Feb 10, 2021
Traded to New York (NY) from Seattle (SEA) for Stephanie Talbot
-
Feb 01, 2018
Signed a 3 year $150,000 contract with Seattle (SEA)
| Year | Team | GP | Min/Gm | Pt/Gm | Reb/Gm | Ast/Gm | Stl/Gm | Blk/Gm | FG% | 3PT% | FT% |
|---|---|---|---|---|---|---|---|---|---|---|---|
| 2025 | PHX | 43 | 23.9 | 9.1 | 2.6 | 2.5 | 0.8 | 0.2 | .385 | .361 | .852 |
| 2024 | SEA | 40 | 15.3 | 5.0 | 1.9 | 1.6 | 0.8 | 0.2 | .346 | .292 | .818 |
| 2023 | SEA | 40 | 24.5 | 9.7 | 2.9 | 2.9 | 0.9 | 0.4 | .400 | .385 | .830 |
| 2022 | NYL | 35 | 21.3 | 6.5 | 2.3 | 2.3 | 0.7 | 0.1 | .368 | .351 | .870 |
| 2021 | NYL | 30 | 28.1 | 11.7 | 5.0 | 2.7 | 1.0 | 0.3 | .473 | .425 | .818 |
| 2020 | SEA | 22 | 16.5 | 8.1 | 2.3 | 2.0 | 0.7 | 0.1 | .443 | .381 | 1.000 |
| 2019 | SEA | 33 | 20.4 | 7.2 | 1.7 | 2.4 | 1.1 | 0.1 | .368 | .342 | 1.000 |
| 2018 | SEA | 31 | 8.5 | 2.9 | 0.9 | 0.5 | 0.5 | 0.1 | .349 | .362 | 1.000 |
| 2017 | SEA | 33 | 12.2 | 4.5 | 1.7 | 1.0 | 0.7 | .361 | .333 | .810 |